

Upflow → Blog → AR metrics
Billing cohorts, the best way to improve your cash collection
Alex Louisy
|
July 31, 2020
Generate AI summary


As a modern finance leader, you know how important it is to measure your company’s financial performance so that you can improve your financial position and better forecast future cash flows.
When it comes to analyzing your accounts receivable and improving your cash collection, the two most important KPIs to track are:
- Days Sales Outstanding (DSO), which measures the average number of days that it takes for your company to collect payment on invoices issued
- what we call the “Percentage Write-Off”, which represents the relative portion of your invoices that are still unpaid more than 180 days after being issued
Why 180 days? Eventually, you’ll need to register a write-off in your accounting system when you know you won’t be able to get paid. From a general and practical standpoint, invoices still unpaid after more than 6 months are very likely to fall into this category.
These metrics are of course highly correlated: if you have a high percentage write-off, this negatively impacts your DSO because old invoices are still outstanding.
But they measure the impact on your business differently: having a high DSO means that you’re bankrolling your customers with essentially zero-interest loans, whereas a high percentage write-off means you are incurring a loss.
In this article, we want to share what we think is the most useful AR dashboard to monitor and walk you through a technique to measure your percentage write-off and ensure that it decreases over time: billing cohorts.
What is a billing cohort?
In essence, a billing cohort tracks groups of invoices that were issued in the same month.
The fundamental idea behind billing cohort analysis is to compare different billing cohorts with one another: for example, you may want to compare the percentage of invoices issued in May 2019 that were paid in under 30 days to those that were issued in September 2019 and that were paid within the same amount of time.
If you’ve been improving your collection efficiency, then the percentage of invoices paid in 30 days that were issued in September should be higher than those that were issued in May.
The best way to visualize this data is by using a 2 by 2 matrix:
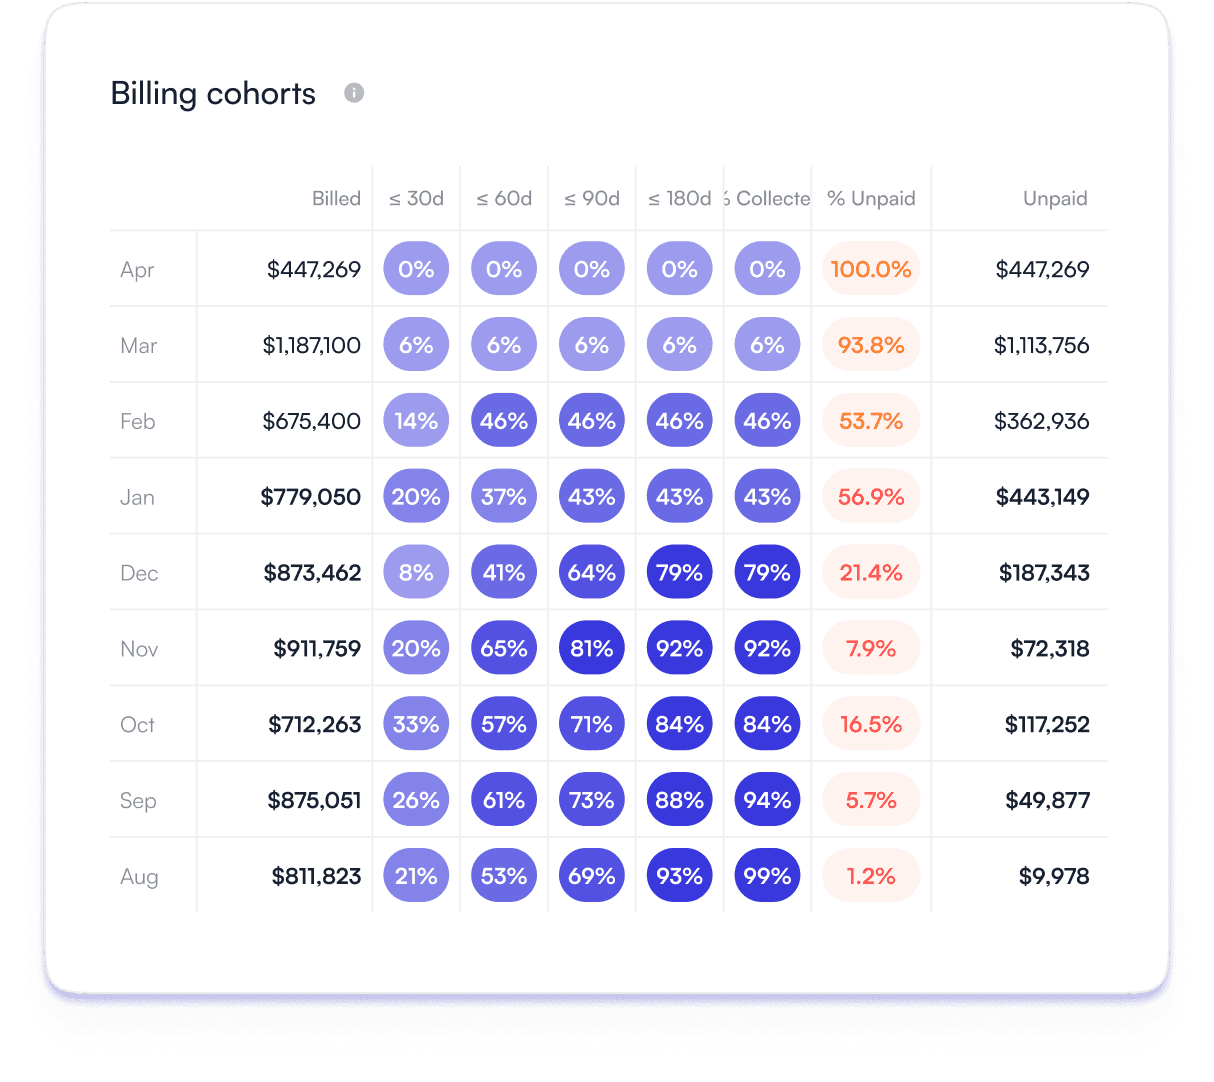
Here, each row represents a different month of billing (a cohort), and each column represents the cumulative percentage of invoices that were paid within a certain time period. So here, for example, we can see that in December, we issued $31k in invoices and 89% of those were paid within 60 days of issuance.
Of course, you should adjust time buckets based on your business and your payment terms.
How to read a billing cohort?
There are two ways to read a billing cohort:
- Left-to-right: this tells you how quickly the invoices in a given month were paid. The numbers are cumulative so they'll always increase, but they should get to 100% quickly. In fact, in an ideal world, the 30-day day bucket should be at 100%.
- Bottom-to-top: this allows you to understand how the speed at which you get paid evolves over time. For example, in the example above, in August, 88% of invoices were paid within 30 days, and in March of the following year, 70% of invoices were paid within the same amount of time. This means that you're becoming less efficient at collections and that it's probably time to make some process changes.
Need help calculating your top A/R metrics? Have a look at our free spreadsheet.
Measuring the ROI of improving your collection efficiency
The first thing you need to do is build the billing cohort matrix of your accounts receivable. We’ve got you covered with our free discover plan! Connect your ERP or billing tool in a few clicks and see your billing cohort matrix

Once done, look at your 180-day bucket. Even if it’s in the low single digits, this can add up to a significant amount of lost revenue (an accounts receivable cost estimator will help you understand exactly how much).
For example, did you know that at $10m revenue, a 0.5% write-off amounts to more than $4k lost every month?
Put differently, if you sell at a 20% margin each write-off will require you to sell 5x (revenue and cost incurred are both lost).
Once you understand the costs, measuring ROI is easy: in the above example reducing your write-offs from 0.5% to 0.3% equates to savings of $1,500 per month or $18k per year.
And the great news is that more often than not, simple process changes are sufficient to achieve those kinds of results.
In summary, every B2B company should be making use of billing cohorts to measure how efficient they are at cash collection, and how that efficiency is evolving over time. That’s the first step – from there you should implement tools that are more sophisticated than spreadsheets to keep track of your unpaid invoices and follow up on them in a systematic way.
At Upflow, we believe it’s all about automation! Our in-house A/R software can help you lower your DSO efficiently by automating your collection process and help you get paid faster. Try out our free Discover Plan by Upflow.

Alex Louisy
Co-founder and CEO of Upflow
Alex is the Co-founder and CEO of Upflow, where he leads the company’s mission to revolutionize how B2B businesses manage their cash flow. Backed by top-tier investors like Hedosophia, YCombinator, Hexa, and Lorimer Ventures, with more than $25m in funding to date, he is a strong advocate for financial transparency and operational excellence, bringing a founder’s perspective to the biggest challenges and opportunities in modern revenue management.
Alex developed Upflow’s widely recognized “5 Maturity Stages of Cash Collection” framework, a model that has helped hundreds of companies build scalable and efficient finance operations. He also co-hosts The Growth-Minded CFO podcast, where he engages with finance and business leaders on innovative approaches to financial leadership. His thought leadership explores the intersection of business strategy, financial discipline, and organizational growth.
As a regular contributor to Upflow’s blog, Alex shares insights on leadership, scaling SaaS businesses, and the future of B2B finance. His writing helps founders, CFOs, and revenue leaders make smarter decisions and build financially resilient companies.
Related articles